Java | Debugging
In the day-to-day life of a programmer, most of the time is spent in debugging. Writing a code can be easy, but fixing a bug can be a nightmare. The java applications can be debugged to check why application is not behaving as expected.
To debug a Spring boot application we have to start application in debug mode. The Spring boot application we created in last post can be debugged as follows -
Intellij Idea -
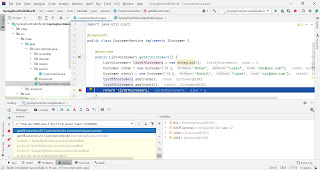
Once the application is started you can add debug points in code by double-clicking on desired line.
As soon as we hit a request, it can be seen that the code execution stopped where debug is added. We check the variables in the right hand side of debug mode. This is useful to check what value is being set. It also has options to mute debug points if we want to continue with normal execution etc.
Most of the IDEs support the Evaluate function. To check some logic, we can right click on code and select Evaluate Expression option where we can add custom code to check values logic etc. This is useful where your code is throwing error/exception which is not getting printed in logs due to incorrect exception handling. Such exceptions/error as ClassDefNotFound can be easily caught.
Hot Swap
In the real scenario there might be a corner case causing an issue which can be caught in debug mode. It is always recommended writing a unit test around coding to minimize code errors.
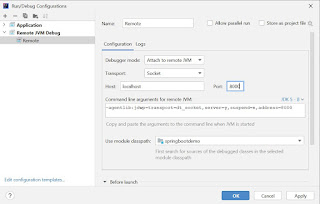
In case of deployed applications, the developer can always use remote debugging.
In the Run configuration the Remote JVM Debug configuration can be added. We have to provide the debug port and host of the remote deployed application.
Spring -
For Spring Boot Application we can add below arguments to application startup to attach debug port. The debug we used in IDE also uses this arguments while starting application.
Use below command to start Spring boot application in debug mode from command line.
We can always change debug port by address=desire_port


Comments
Post a Comment